
Following last week’s article, we received some questions about specifics around college reporting, and what specific metrics are important to follow. Out of all metrics with which we have worked, there is one common thread that makes all other variables clearer: Cohort comparatives.
One can look at data all day long and find very little meaning, but once cohort comparatives are inserted, the data will come alive.
The following example is based on a fake strategy by a fake college which we we’ll call College-A. In this example, the base year is 2015 (to illustrate two years’ worth of usable data).
The Problem: College-A has noticed a drop in incoming headcount and needs to develop a strategy to balance their student body.
The Strategy: College-A has decided to guarantee tuition for four years for any freshman entering in the fall of 2015.
The following graphs represent (A) Headcount, (B) Income, (C) Number of Freshman, and (D) Total Student Body.

This graph shows a definite inflection point around 2015. It illustrates that the institution has turned a corner on increasing headcount.
The following is how the population looks year by year.

As one would expect from sample (fake) data, the freshman population appears nice and steady, to the tune of 1,000 new students every year.
However, that was never the problem that College-A was trying to solve. Retention is the target goal, and this graph shows an increase in sophomore retention starting in 2015. (We would not expect any changes to affect retention of other classes, as they have not yet experienced the effect of the “Price Guarantee.”) By observing then what happens when sophomores become juniors, it illustrates the effect that College-A desires!
What did that "Price Guarantee" cost the college?
The next graph compares the “what if” scenario of total income gained by raising tuition and fees every year, versus what happened when a “Price Guarantee” was implemented.

Despite achieving its goals, there is clearly a cost associated with this program, and that has significantly changed the cumulative cash at hand for College-A.
The remaining question for the institution then becomes, Should we keep on going, or should we scrap this program? To best answer that question, we need to look at cohort retention in a much smarter way.
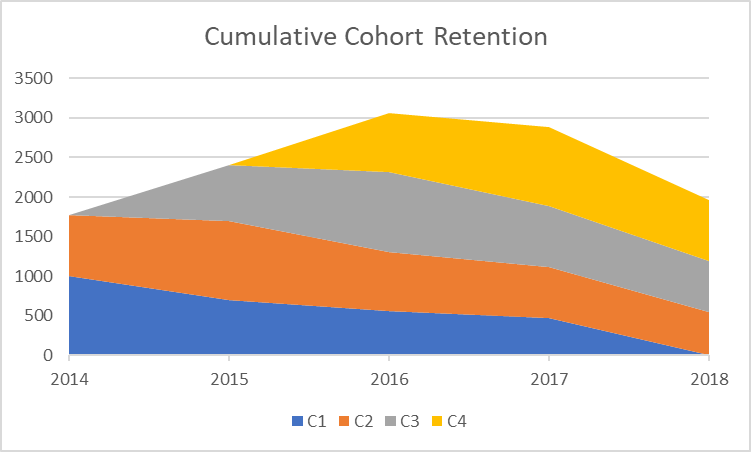
Consider the following graph, which shows the same data presented above, but under a new light. It shows the cumulative effect of the retention bulge that was well received by College-A in the graph above.

By observing the data in this way, we can clearly see the bulge moving through the different cohorts. C1 is the group who entered as freshman in 2014; C2 entered in 2015, C3 entered in 2016, and C4 entered in 2017. This is the most compelling of all graphs shown because it clearly displays the effect of the “Price Guarantee” in the minds of the students.
While the 2014 cohort was not directly impacted or phased by the decision (which was made in 2015 and it did not include them), we can clearly see how retention has increasingly improved our retention from 2015 through now. The areas are enlarging, which means College-A has achieved the goal it set to achieve. (This would be particularly interesting and even more useful if this plan had caused unwanted attrition in the 2014 cohort that was on campus when the announcement was made but that could not take advantage of the “Price Guarantee.”)
As a parting thought, we ask you: Would college income improve as this plan takes hold? Perhaps that is a topic for another article.