How sustainable is the cost of your tuition and fees? Let’s first understand the numbers.
Recent certified data (usually a year behind) shows that the average cost of tuition in the “2016–2017 school year was $33,480 at private colleges, $9,650 for state residents at public colleges, and $24,930 for out-of-state residents attending public universities.”[1] At the most basic level, simply compare the cost of your institution to these numbers, and one can get a feel for if the institution is (but doesn't consider itself to be) an isolated factor. Rather, this comparative is only good to illustrate how much head space the institution has if it needs to adjust its top line. For example, a private institution with a total cost if $19,000.00/year has some room to increase tuition and fees, but an institution with tuition hovering in the $40,000.00 range would face difficulty increasing any part of its cost structure.
It is important to say FundFive believes the rising cost trends in education as defined by increases beyond inflationary adjustments are reversible and must be carefully measured against its impact to students. This article is not a discussion on philosophies related to access to education (which have enormous merit), but instead concentrates on decisions related to the vital sustainability of college operations, and the difficult answers to hard questions administrators have no choice but to answer.
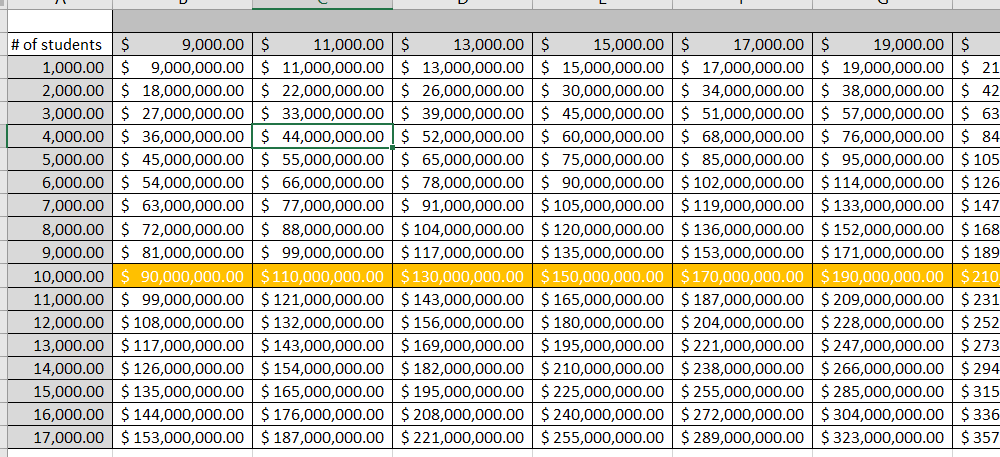
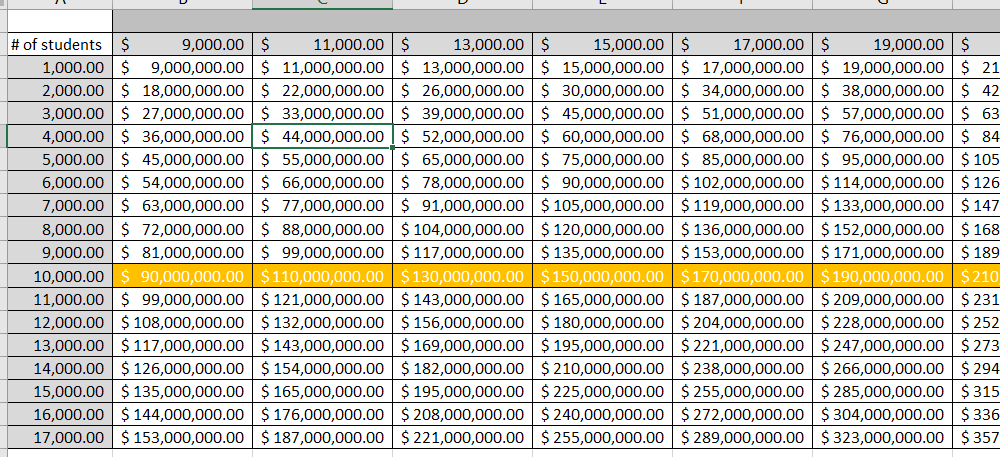
That said, let's continue this thinking process. Included are three tables to help frame the rest of this conversation. The first table (below) contains average tuition and fee costs, which range between $9,000/year and $40,000/year, versus the number of students in the simulated institutions. The resulting table displays simple income for the institution, or simple top line. (Note: don’t worry about considering the complexities of financial aid. That will come later.) Here is a snapshot of the table:

Next, consider the institutional discount rate (which is financial aid institutional money) as a whole. This table will be connected to the pseudo institution highlighted above for an institution with approximately 10,000 students. This is what that table looks like:

Next, we will create a table called the “Opportunity Table”. It lists the opportunities for the institution related to income from reductions in the discount rate:

What this table tells us is that in this pseudo 10,000 student institution, for every discount rate change of 1%, it will save the college $900,000.00 per year (considering a yearly tuition rate of $9,000). For an institution of 13,000 students, that savings equates to $1.3 million, and so on. Although the math is obvious, laying it out in three parts will set your mind on the moving parts of this problem.
How hard is it to move the discount needle by 1%? It may be challenging, but it is perfectly attainable. If your institution keeps a firewall between student aid and institutional funds, such as many public institutions, then use these same tables and substitute discount rate for income loss. If you find these numbers to be worth an institutional change, then push hard for it.
Considerations around these tables will also give you a gut feeling about what your institution is willing to do. If decreasing the discount rate or income loss does not sit well with administration, then you must increase top line income. The cultural changes needed to make that happen are beyond the scope of this article, but we will explore those topics at a later time.
[1] http://www.collegedata.com/cs/content/content_payarticle_tmpl.jhtml?articleId=10064


